Raport de vânzări
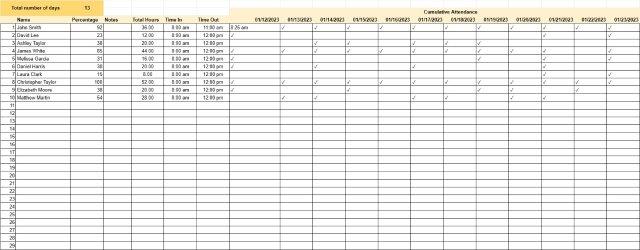
Loại : Trình theo dõi
Vânzătorul folosește acest lucru pentru a ști cum se descurcă la ultima operațiune.
Un șablon de raport de vânzări este un document folosit de companii pentru a urmări, analiza și prezenta datele de vânzări pe o anumită perioadă. Rapoartele de vânzări sunt vitale pentru monitorizarea performanței vânzărilor, identificarea tendințelor și luarea deciziilor bazate pe date. Acestea sunt utilizate de obicei de echipele de vânzări, manageri și directori pentru a evalua eficacitatea strategiilor de vânzări și a stabili obiective viitoare.
Componentele cheie ale unui șablon de raport de vânzări:
- Titlul raportului: titlul include de obicei perioada acoperită de raport (de exemplu, Raportul de vânzări lunar, Analiza trimestrială a vânzărilor).
- Interval de date: specifică intervalul de date pentru care sunt raportate datele despre vânzări (de exemplu, lună, trimestru, an).
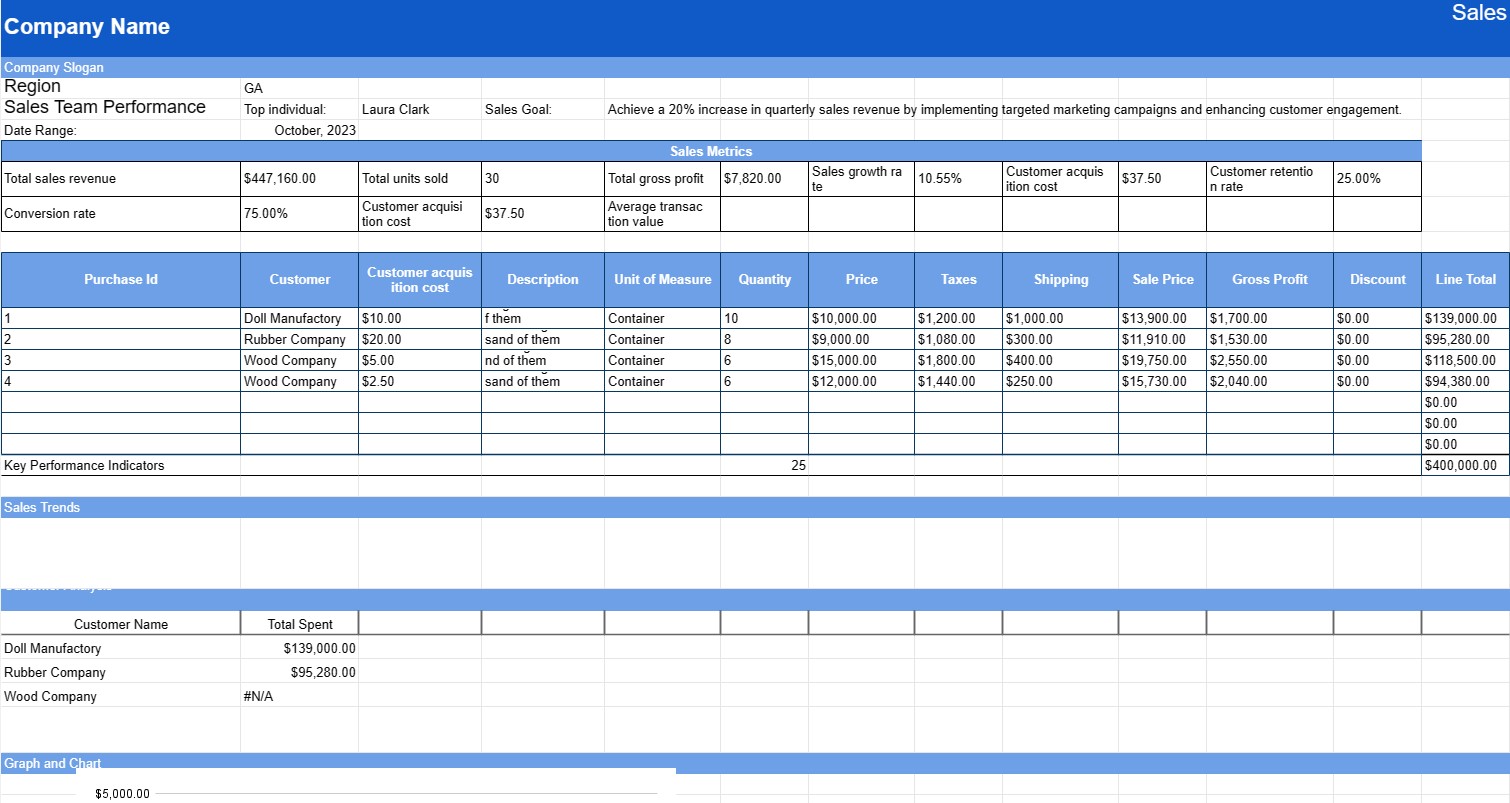
- Rezumat: oferă o imagine de ansamblu concisă a performanței vânzărilor în perioada de raportare, inclusiv venitul total din vânzări, numărul de unități vândute și orice realizări sau repere semnificative.
- Metrici de vânzări: prezintă valori cheie de vânzări și KPI (indicatori cheie de performanță), cum ar fi:
- Venit total din vânzări
- Total unități vândute
- Profit brut
- Rata de creștere a vânzărilor
- Valoarea medie a tranzacției
- Costul de achiziție a clienților
- Rata de reținere a clienților
- Rata de conversie
- Vânzări în funcție de produs/ Serviciu:Detaliază datele de vânzări pentru fiecare produs sau serviciu, inclusiv cantitatea vândută, prețul unitar și venitul total generat. Această secțiune poate include diagrame sau grafice pentru reprezentare vizuală.
- Vânzări în funcție de regiune sau teritoriu: dacă este cazul, raportul poate descompune datele despre vânzări în funcție de regiune geografică sau teritoriu de vânzare, evidențiind zonele de performanță puternică și slabă.
- Produse/Servicii cu cele mai bune performanțe: enumeră produsele sau serviciile cele mai vândute în perioada de raportare, împreună cu cifrele de vânzări ale acestora.
- Tendințe de vânzări: oferă o analiză a tendințelor de vânzări, cum ar fi sezonalitatea sau modificările comportamentului clienților și explică modul în care aceste tendințe au afectat vânzările.
- Analiza clienților. : Include date despre datele demografice ale clienților, comportamentul de cumpărare și orice modificări notabile ale profilurilor clienților.
- Provocări și oportunități: identifică provocările cu care se confruntă în perioada de raportare (de exemplu, concurența de pe piață) și oportunități de îmbunătățire sau creștere.
- Performanța echipei de vânzări: evaluează performanța echipei de vânzări, evidențiind realizările individuale sau ale echipei, obiectivele îndeplinite și zonele de îmbunătățire.
- Recomandări: oferă recomandări și acțiuni bazate pe analiză, cum ar fi ajustări ale strategiilor de vânzări, prețurilor sau ofertelor de produse.
- Grafice. și diagrame: utilizează reprezentări vizuale precum diagrame cu bare, diagrame circulare și grafice cu linii pentru a face datele mai accesibile și mai ușor de înțeles.
Beneficiile utilizării unui șablon de raport de vânzări:
- Evaluarea performanței: Permite companiilor să-și evalueze performanța vânzărilor în raport cu obiectivele și obiectivele.
- Luarea deciziilor bazată pe date: Oferă informații valoroase pentru a lua decizii în cunoștință de cauză cu privire la strategiile de vânzări și alocarea resurselor.
- Setarea obiectivelor: ajută la stabilirea obiectivelor și obiectivelor de vânzări realiste pentru perioadele viitoare.
- Analiza tendințelor: identifică tendințele și modelele în datele de vânzări, permițând răspunsuri proactive la schimbările pieței.
- Comunicare: facilitează comunicarea și transparența în cadrul organizației prin partajarea date și perspective cu părțile interesate.
- Motivație: recunoaște și motivează echipele de vânzări prin recunoașterea realizărilor.
- Evaluare comparativă: permite comparații între diferite perioade de timp, produse sau regiuni în scopuri de benchmarking.
În concluzie, un șablon de raport de vânzări este un instrument esențial pentru ca întreprinderile să urmărească și să-și evalueze performanța vânzărilor în mod cuprinzător. Oferă un format structurat pentru prezentarea datelor de vânzări, tendințe și recomandări, dând putere organizațiilor să ia decizii bazate pe date și să își optimizeze strategiile de vânzări.
Dễ dàng xem trước và tải xuống mẫu bảng tính
Xem phiên bản đầy đủ của mẫu bảng tính không có giới hạn để xem nếu bạn thích nó thì bạn có thể tải xuống mẫu excel để lưu trữ trên thiết bị của mình và sử dụng miễn phí.
Truy cập mẫu bảng tính từ mọi nơi
Tính năng này hoạt động trên tất cả các hệ điều hành phổ biến như Windows, MacOS, Linux, iOS. Bạn có thể xem các mẫu bảng tính và tải chúng xuống mà không cần chương trình bổ sung.
Cách sử dụng mẫu
Tìm hiểu cách xem trước, tải xuống và sau đó sử dụng mẫu bảng tính bằng cách làm theo các bước cực kỳ dễ thực hiện
Nhiều mẫu tương tự hơn
Xem thêm các mẫu bảng tính cùng danh mục với mẫu đã chọn.