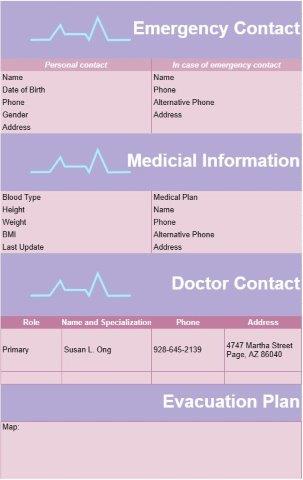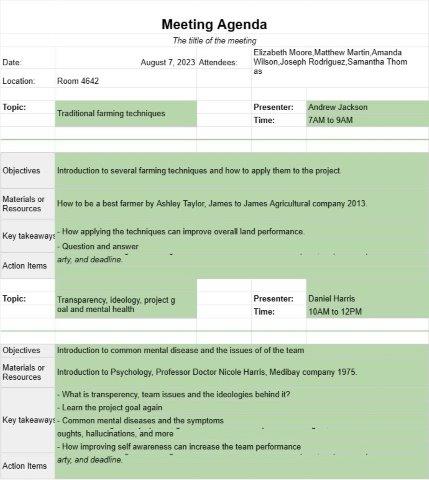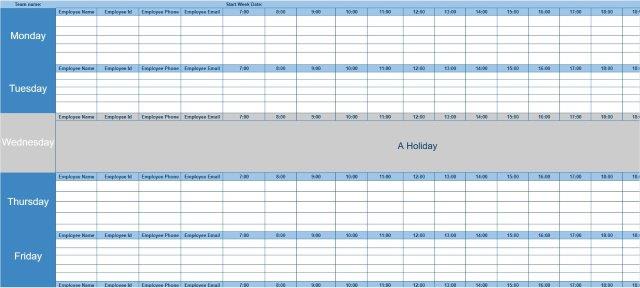
Graph Model
Kategori : Planerare
This is simply a paper for you to draw the graph with highlighted boxes on it much this much more easier to sketch.
A Graph Model Template is a versatile tool used in various fields, such as mathematics, computer science, engineering, and data analysis. It provides a structured framework for representing and analyzing data or relationships between entities using graph theory. Graphs are composed of nodes (vertices) and edges (connections between nodes), and they are a fundamental concept in network analysis, data visualization, and problem-solving.
User can use this Graph Model Template to add and create graph which can contain:
- Nodes (Vertices): Nodes represent entities, objects, or data points within the graph. Each node may have a label or identifier to distinguish it from others.
- Edges (Connections): Edges define the relationships or connections between nodes. They can be directed (with an arrow indicating the direction of the relationship) or undirected (no specific direction).
- Weights or Costs: For graphs used in applications like network routing or optimization, edges may have associated weights or costs that represent the cost of traversing the edge.
- Attributes or Properties: Nodes and edges can have additional attributes or properties. For example, in a social network graph, nodes might represent individuals with attributes like age, location, and interests.
- Graph Type: The template may specify the type of graph, such as a directed graph (digraph), undirected graph, weighted graph, bipartite graph, or other specialized types.
- Graph Visualization: In some cases, the template includes a visual representation of the graph, helping users understand the structure and relationships within the data.
- Graph Algorithms: For advanced applications, the template may include sections for implementing or describing graph algorithms like Dijkstra's algorithm, breadth-first search (BFS), or depth-first search (DFS).
Benefits of Using a Graph Model Template:
- Data Representation: Allows for the clear and visual representation of complex data structures and relationships.
- Problem Solving: Graphs are used to solve various real-world problems, such as finding the shortest path in a transportation network, identifying communities in social networks, or optimizing resource allocation.
- Data Visualization: Graphs provide a visual and intuitive way to represent data, making it easier to analyze and communicate information.
- Network Analysis: Useful for analyzing networks, including social networks, transportation networks, computer networks, and more.
- Data Modeling: Enables the modeling of complex systems and dependencies, aiding in system design and simulation.
- Efficiency: Graph algorithms are often highly efficient for solving specific types of problems, such as route optimization or network flow analysis.
- Pattern Recognition: Graph analysis can reveal patterns, anomalies, and trends within the data.
In summary, a Graph Model Template is a versatile tool used for representing and analyzing data in the form of graphs. It is applicable to a wide range of domains and provides a structured framework for modeling relationships, solving complex problems, and gaining insights from data. Whether used in mathematics, computer science, engineering, or data analysis, graph models are valuable for understanding and visualizing complex systems and networks.
Enkel förhandsgranska och ladda ner kalkylbladsmall
Se den fullständiga versionen av en kalkylarksmall utan begränsningar för att se om du gillar den, sedan kan du ladda ner excelmallen för att lagra den på din enhet och använda den gratis.
Få åtkomst till kalkylbladsmall var som helst
Detta fungerar på alla populära operativsystem som Windows, MacOS, Linux, iOS. Du kan se kalkylbladsmallarna och ladda ner dem utan ytterligare program.
Hur man använder en mall
Ta reda på hur du förhandsgranskar, laddar ner och sedan använder kalkylarksmallen genom att följa stegen som är extremt enkla att följa
Fler liknande mallar
Se fler av kalkylbladsmallarna som är under samma kategori som den valda.