Model gràfic
Categoria : Planificadors
Aquest és simplement un paper per dibuixar el gràfic amb quadres ressaltats, molt més fàcil de dibuixar.
Una plantilla de model de gràfics és una eina versàtil que s'utilitza en diversos camps, com ara les matemàtiques, la informàtica, l'enginyeria i l'anàlisi de dades. Proporciona un marc estructurat per representar i analitzar dades o relacions entre entitats mitjançant la teoria de grafs. Els gràfics es componen de nodes (vèrtexs) i arestes (connexions entre nodes) i són un concepte fonamental en l'anàlisi de xarxes, la visualització de dades i la resolució de problemes.
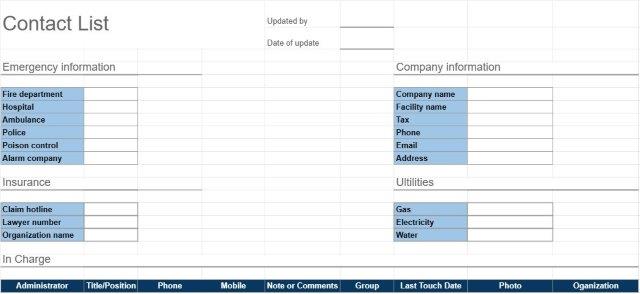
L'usuari pot utilitzar aquesta plantilla de model de gràfics per afegir-hi i crear un gràfic que pot contenir:
- Nodes (vèrtexs): els nodes representen entitats, objectes o punts de dades dins del gràfic. Cada node pot tenir una etiqueta o un identificador per distingir-lo dels altres.
- Arestes (Connexions): Les vores defineixen les relacions o connexions entre nodes. Poden ser dirigits (amb una fletxa que indica la direcció de la relació) o no dirigits (sense direcció específica).
- Pesos o costos: per a gràfics utilitzats en aplicacions com l'encaminament de xarxa o optimització, les vores poden tenir pesos o costos associats que representen el cost de travessar l'aresta.
- Atributs o propietats: els nodes i les vores poden tenir atributs o propietats addicionals. Per exemple, en un gràfic de xarxa social, els nodes poden representar persones amb atributs com l'edat, la ubicació i els interessos.
- Tipus de gràfic: la plantilla pot especificar el tipus de gràfic, com ara com a gràfic dirigit (dígraf), gràfic no dirigit, gràfic ponderat, gràfic bipartit o altres tipus especialitzats.
- Visualització de gràfics: en alguns casos, la plantilla inclou una representació visual de el gràfic, ajudant els usuaris a entendre l'estructura i les relacions dins de les dades.
- Algoritmes de gràfics: Per a aplicacions avançades, la plantilla pot incloure seccions per implementar o descriure algorismes de gràfics com l'algorisme de Dijkstra, cerca en profunditat (BFS) o cerca en profunditat (DFS).
Avantatges d'utilitzar una plantilla de model gràfic:
- Dades Representació: Permet la representació clara i visual d'estructures i relacions complexes de dades.
- Resolució de problemes: Els gràfics s'utilitzen per resoldre diversos problemes del món real, com ara trobar el camí més curt en una xarxa de transport, identificar comunitats a les xarxes socials o optimitzar l'assignació de recursos.
- Visualització de dades: els gràfics proporcionen una manera visual i intuïtiva de representar les dades, fent-les més fàcil d'analitzar i comunicar informació.
- Anàlisi de xarxes: Útil per analitzar xarxes, incloses xarxes socials, xarxes de transport, xarxes informàtiques i molt més.
- Modelado de dades: permet el modelatge de sistemes complexos i dependències, ajudant en el disseny i la simulació del sistema.
- Eficiència: els algorismes de gràfics solen ser molt eficients per resoldre tipus de problemes, com ara l'optimització de rutes o l'anàlisi del flux de xarxa.
- Reconeixement de patrons: l'anàlisi de gràfics pot revelar patrons, anomalies i tendències dins de les dades.
En resum, una plantilla de model de gràfics és una eina versàtil que s'utilitza per representar i analitzar dades en forma de gràfics. És aplicable a una àmplia gamma de dominis i proporciona un marc estructurat per modelar relacions, resoldre problemes complexos i obtenir informació a partir de les dades. Tant si s'utilitzen en matemàtiques, informàtica, enginyeria o anàlisi de dades, els models de gràfics són valuosos per entendre i visualitzar sistemes i xarxes complexos.
Fàcil visualització prèvia i descàrrega de la plantilla de full de càlcul
Vegeu la versió completa d'una plantilla de full de càlcul sense limitacions per veure si us agrada, podeu descarregar la plantilla d'Excel per emmagatzemar-la al vostre dispositiu i utilitzar-la gratuïtament.
Accediu a la plantilla de full de càlcul des de qualsevol lloc
Això funciona en tots els sistemes operatius populars com Windows, MacOS, Linux, iOS. Podeu veure les plantilles de full de càlcul i descarregar-les sense programes addicionals.
Com utilitzar una plantilla
Descobriu com previsualitzar, baixar i utilitzar la plantilla del full de càlcul seguint els passos que són molt fàcils de seguir
Plantilles més semblants
Vegeu més de les plantilles de full de càlcul que es troben a la mateixa categoria que l'escollida.